Some Facts, For a Change, About Climate Change
A fresh challenge to conventional climate-change thinking examines ocean temperatures, atmospheric energy flows and historical climate patterns, questioning the science behind catastrophic warming predictions.
The alleged threat to the planet from human-caused climate change has been at the forefront of international politics over the recent half-century. Every year, just before meetings of the UN Conference of the Parties (COP) to the Climate Change Convention, slight increases in atmospheric carbon dioxide and global temperature are portrayed in the media as harbingers of future doom. Every extreme weather event is made out to be an ill omen of what is to come unless burning of fossil fuels is eliminated.
Globally, billions of research dollars have been expended building complex computer models that reinforce a projected dire future scenario if carbon-dioxide emissions are allowed to continue to increase at historic rates. According to model projections, Earth’s temperature will rise several degrees Celsius by the end of the century, making many regions unliveable. Also, the polar ice caps may melt, causing sea-level rise to swamp low-lying coastal regions, including many large cities. There may even be “tipping points” leading to runaway global warming.
There is little evidence of unprecedented weather extremes or dangerous climate change. Forty-five years of satellite-based global monitoring point to a slowly warming climate responding to Earth’s natural processes.
The United Nation’s Intergovernmental Panel on Climate Change (IPCC) claims that global warming caused by the burning of fossil fuels is well-founded in science. The reality is that the IPCC claims are based on the projections of computer models whose constructs have a fundamental flaw: they are constructed on the assumption that the temperature of the atmosphere varies with the changing concentration of carbon dioxide.
An often-quoted statement is that the greenhouse gases of the atmosphere (principally water vapour, but also minor gases such as carbon dioxide, methane, ozone, oxides of nitrogen) absorb radiation from the surface to act like a blanket and keep Earth warmer than it would otherwise be. Therefore, it is suggested, adding more carbon dioxide will thicken the blanket to make Earth hotter.
The reality is — as reflected in IPCC documents (see Figure 1 below) — that the greenhouse gases emit more radiation, both to space and back to Earth, than they absorb. Greenhouse gases tend to cool the atmosphere at a rate of more than one degree Celsius per day. However, the cooling tendency is offset by energy, as heat and the latent energy contained in evaporating water vapour, that flows from the surface to the atmosphere.
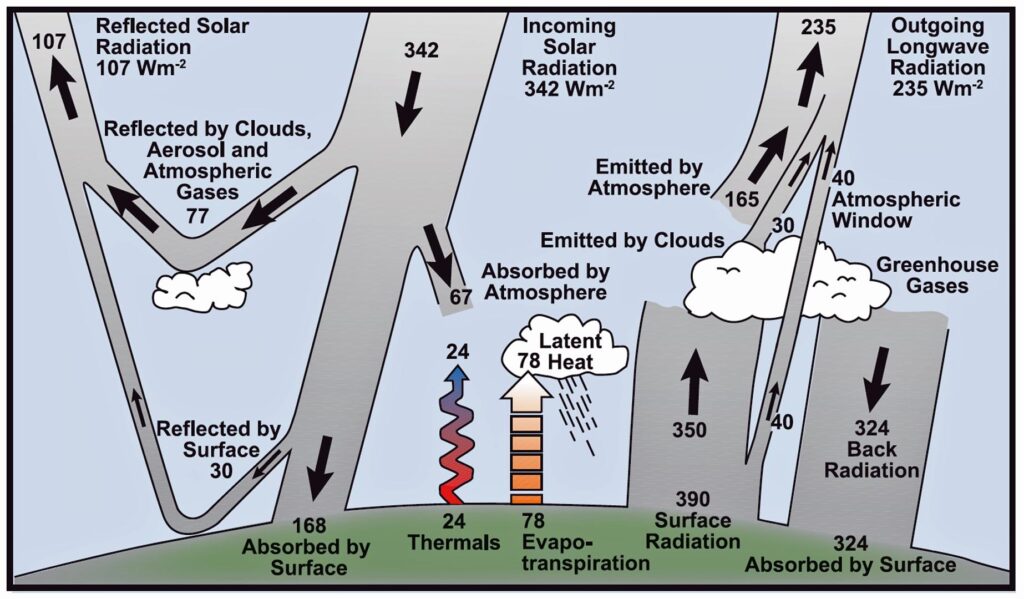
Figure 1: Greenhouse gases emit more radiation than they absorb and tend to cool the atmosphere. The global and annual average Earth energy budget is from an IPCC assessment and based on the work of Kiehl and Trenberth. The greenhouse gases, clouds and aerosols emit 195 watts per square metre to space and 324 W/m2 back to the surface (Total emissions 519 W/m2). The greenhouse gases, clouds and aerosols absorb 350 W/m2 emitted from the surface and 67 W/m2 of solar radiation (Total absorption 417 W/m2). That is, the loss of radiation energy at a rate of 102 W/m2 tends to cool the atmosphere. The radiation loss is offset by a flow of heat (24 W/m2) and latent energy of evaporation (78 W/m2) from the surface to the atmosphere.
Acting like a blanket is an erroneous metaphor for the role of greenhouse gases. Sustaining Earth’s temperature requires a more complex construct of the many energy-exchange processes identified in Figure 1.
Dominance of Oceans
In discussing energy flow through the climate system, it is important to recognise that the mass and thermal capacity of the oceans dominates the atmosphere. The mass in an air column is equivalent to the mass in about ten metres of ocean water in a similar column; the thermal capacity of the air column is equivalent to about four metres of a similar ocean water column. The ocean depth averages about 3,000 metres, meaning that the body of ocean fluid dominates the atmosphere fluid. It is often said that the oceans are the inertial and thermal flywheels of the climate system.
A revelation from comprehensive climate monitoring, including the use of satellite-based instruments, is that the equatorial ocean temperature regulates the atmospheric temperature (see Figure 2 below). It is deep convection within the warm equatorial region that distributes much of the heat and latent energy from the surface through the atmosphere. It is this distribution of heat and latent energy that offsets the loss of radiation energy and sustains the temperature of the atmosphere.
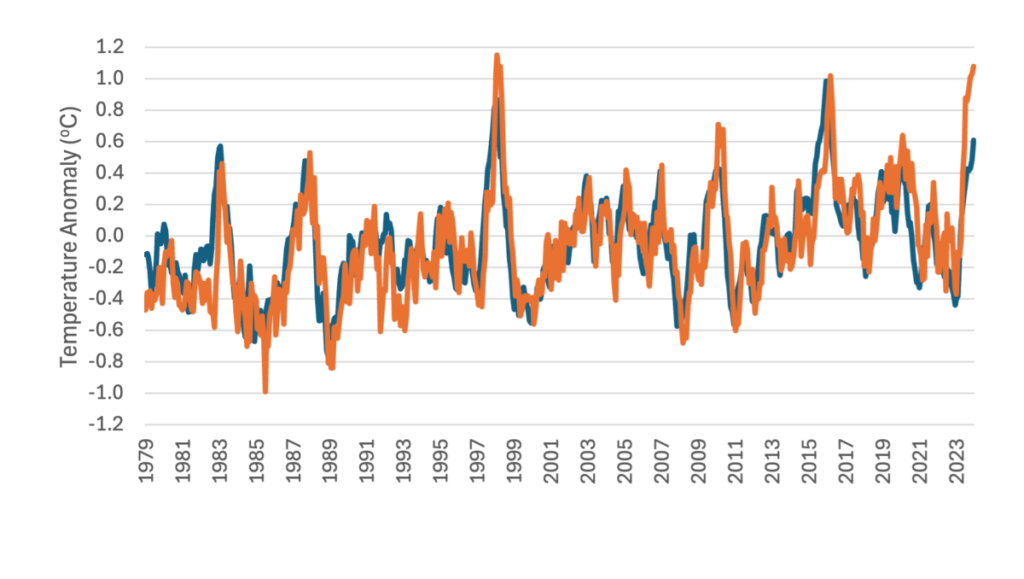
Figure 2: The temperature of the tropical atmosphere is regulated by equatorial ocean surface temperature. The chart is of equatorial sea surface temperature (blue) and 700mb (approximately 3km altitude) temperature (red) since 1979 (Latitudes 10S to 10N). The major interannual fluctuations represent El Niño and La Niña events. The rate of warming of ocean temperature (trend) has been 0.65 degrees Celsius a century. The detrended correlation between ocean surface and 700mb temperatures is 0.70. (Data are from the NCEP/NCAR R1 dataset)
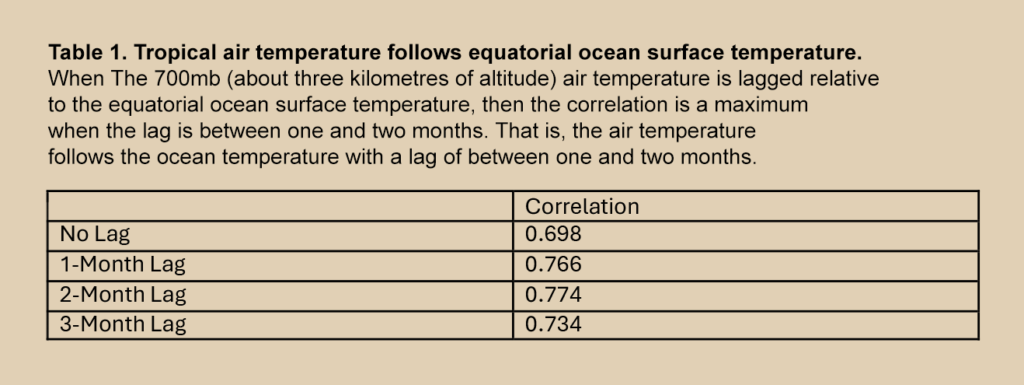
As equatorial ocean temperatures have varied with El Niño events, so too the temperature of the tropical atmosphere has varied, with a lag of about six weeks (see Table 1 below). Clearly, it is the equatorial ocean temperatures, the warmest oceans of the planet, that regulate the overlying tropical atmosphere temperature. The equatorial oceans have warmed over the recent half-century at a rate of 0.65 degrees Celsius/century, and the ocean warming has warmed the tropical atmosphere and increased the rate of flow of heat and latent energy to the atmosphere.
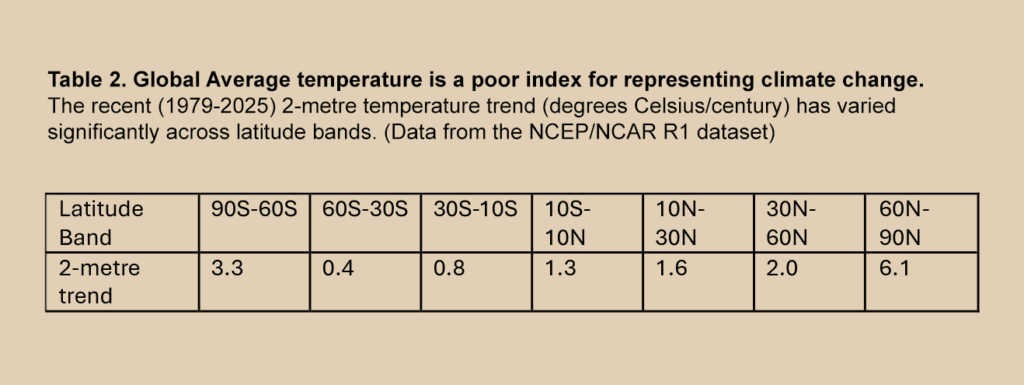
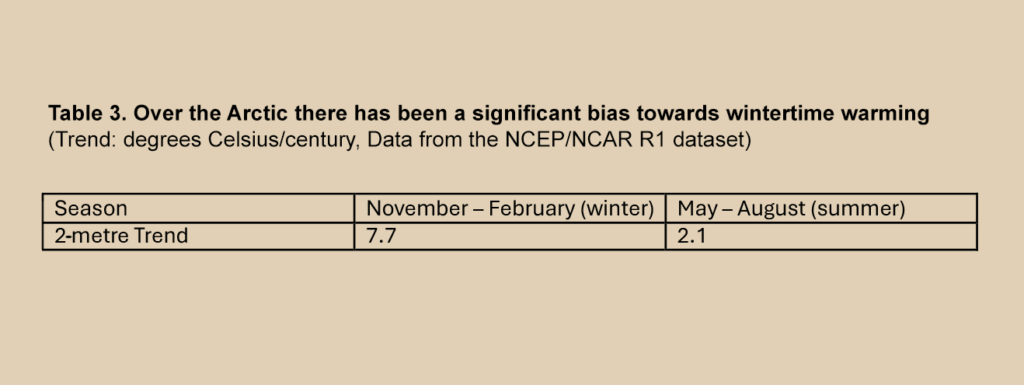
A second revelation from global monitoring is that Earth’s recent warming has not been globally uniform. Global average temperature is a poor index of climate change (see Table 2 below). Warming was essentially absent from latitudes of the Southern Ocean. The rate of warming has been greatest over the frozen polar regions. The most rapid rate of warming, at nearly eight degrees Celsius per century, has been over the Arctic during the darkness of winter. This compares to an Arctic warming rate of only about two degrees Celsius per century during the sunlit months of summer.
The IPCC explanation of Earth’s recent warming, that it has been due to an enhanced greenhouse effect, cannot be valid. The greatest warming has been occurring over the frozen Arctic during the darkness of winter, a time when there is net radiation loss to space and little incoming solar radiation (see Table 3 below). Arctic warming is a response to an increase in the rate of transport of energy from the tropics, which is at a maximum during winter months. The polar warming has nothing to do with carbon dioxide concentrations.
There is also no valid link between additional atmospheric carbon dioxide concentration and rising ocean surface temperatures. Surface temperature responds to the changing flows of absorbed radiation (both solar and the longwave emitted by greenhouse gases, clouds and aerosols) and loss of energy (through emission of longwave radiation and the flow of heat and latent energy to the adjacent atmosphere).
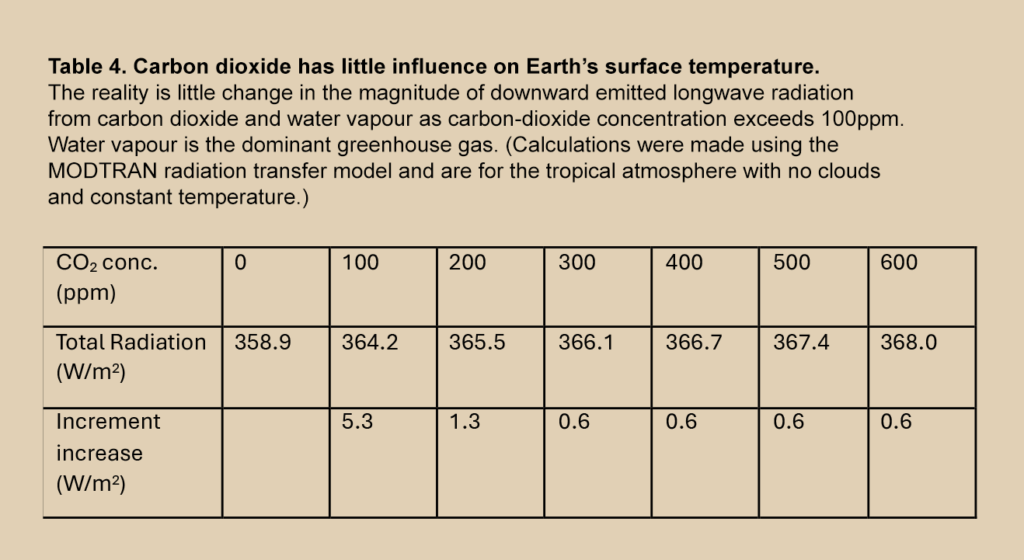
Carbon dioxide absorbs and emits longwave radiation over wavelength bands in common with water vapour. At tropical temperatures, the concentration of water vapour at the surface is about 50 times greater than that of carbon dioxide. Radiation emitted by carbon dioxide is largely absorbed by the more numerous water-vapour molecules. As carbon dioxide concentration increases, there is no significant increase in longwave-radiation emission to warm the oceans.
Since industrialisation, for each 100-parts-per-million increase in carbon dioxide concentration, the increase in radiation emitted by the greenhouse gases and reaching the surface was about 0.6 watts per square metre (W/m2). That is, an increase of about 0.2 per cent of the magnitude of radiation emitted by water vapour.
Note that from the last glacial maximum 20,000 years ago to preindustrial times, the carbon dioxide concentration increased from near 200ppm to near 300ppm (an increase of only 100ppm). During this period, the polar ice sheets covering much of North America and northern Europe melted, and sea level rose about 130 metres. In contrast, since industrialisation, carbon dioxide has increased by more than 100ppm, but sea-level rise has been insignificant. The evidence does not suggest that carbon dioxide concentration is influential in changing ocean temperature or the climate (see Table 4 below).
Is a continuation of recent warming, focused as it has been over polar regions in winter, likely to be dangerous for the planet? The most obvious impact of recent warming has been an earlier onset of spring thaw and a delay in autumn freeze over the middle and high latitudes of the Northern Hemisphere as the rate of wintertime transport of heat from the tropics has increased.
These have increased the duration of seasonal ice melt. Consequently, there has been a reduction in the mass of the polar ice sheets and a retreat of mountain glaciers. However, the increase in annual ice mass loss is limited by the increase in the rate of transport of heat from the tropics. The rate of sea-level rise will continue to be modest and manageable.
The recent middle and high-latitude warming has produced benefits. The earlier thaw and later freeze have extended the growing seasons over those latitudes. Anecdotal reports from Northern Europe and North America suggest that the growing season has lengthened by as much as 20 days. NASA satellites clearly show a greening of the planet as the temperature-constrained biosphere has responded to the longer growing season. Importantly for civilisation, the longer growing season, with technology and the fertilising effect of more carbon dioxide, has enormously increased food production.
History suggests that the most recent warming has followed a pattern of middle and high-latitude temperature change like those experienced in earlier times. During the Roman occupation of Britain, crops were grown over northern parts, including vines. With the onset of cold during the Dark Ages, winter temperatures dropped, rivers across Europe froze over, and food production declined with ensuing famine. Later, during the warmth of the Medieval Period, the Norse were able to sustainably colonise Arctic regions, including settlements in Greenland. The return of cold during the Little Ice Age brought the demise of the Greenland settlements, and again brought wintertime freezing of European rivers and the extension of glaciers in the Alps.
There is clearly a disconnect between the climate scenarios projected by computer models and the characteristic regional climate trends recorded over the last half-century. History suggests that civilisations prosper during warmer climate phases but suffer during the colder phases of the cycle. This is contrary to the dire predictions of an ever-warming planet for future generations that activists have gleaned from computer models.
The enormous cost burden in the so-called transition to a non-fossil fuel-powered economy is bankrupting those nations following the net-zero objective, but it is having no impact on the course of the climate. The oceans are Earth’s heat bank whose temperatures respond to its slowly changing currents. The atmosphere tail, and its changing carbon dioxide concentration, does not wag the climate dog!
___
Republished with thanks to News Weekly. Image courtesy of Adobe.
Recent Articles:

13 November 2026
4.4 MINS
A sobering new study reveals that two-thirds of American Christians fail a basic Bible knowledge test, exposing a crisis of biblical literacy within the Church.
13 November 2026
3.5 MINS
Historian Christopher Dawson argued that religion is the spiritual foundation of civilisation. As Christianity retreats from public life, his warnings about cultural decline deserve renewed attention.

13 November 2026
9.1 MINS
Understanding Islam requires more than interfaith goodwill. Examining its theology, political ambitions, migration and Western alliances, we require vigilance without abandoning Christian compassion.
12 November 2026
3.1 MINS
Andrew Denton wants to liberalise Australia’s assisted suicide laws further, but the Dutch experience raises serious questions about where voluntary assisted dying (VAD) ultimately leads and who will be affected.

12 November 2026
2.2 MINS
Chris Bowen’s renewable energy agenda is driving power prices higher, leaving Australians paying the price for Labor’s decision to abandon reliable coal-fired electricity.

11 November 2026
4.6 MINS
Donald Trump’s candid admission that he struggles to forgive his enemies has sparked debate, but Franklin Graham’s response points to a far more important question: salvation.

11 November 2026
3.1 MINS
North Korea's underground Christians face imprisonment, forced labour and even death for following Christ, yet their faith endures despite decades of brutal communist persecution.